Make Dice Work For You is a series where I’ll regularly talk through a new way to use dice in your game. It came out of conversation surrounding What to randomise when you’re randomising, and what advanced techniques you can use for specific needs. I’ll where I know, but please help me out if you know a citation and I don’t have one, or if you know an example that I can add!
Whenever you roll 2 or more dice and then add the results, the likelihood of any given number in the available range is different. It follows a curve known as a bell curve. In this I’ll be using a bunch of anydice charts to help visualise things.

What this means, is that the smallest and largest numbers are the least likely to occur, and the number that is in the middle is the most likely to occur. This pattern occurs for any dice.
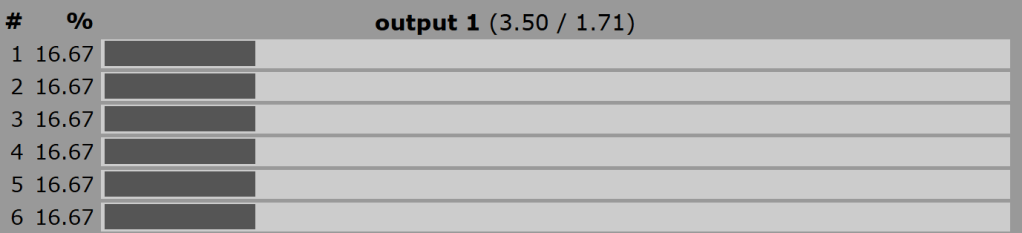
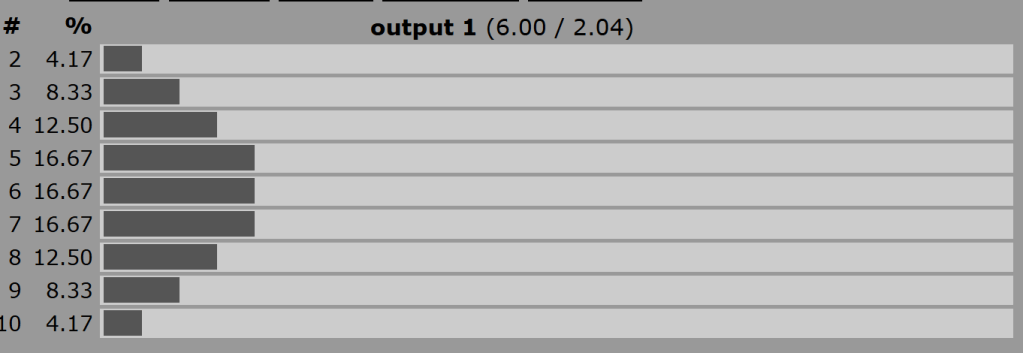
Scroll through to see the similar bell-shaped pattern and the specific distributions of chance. This is 1d6. 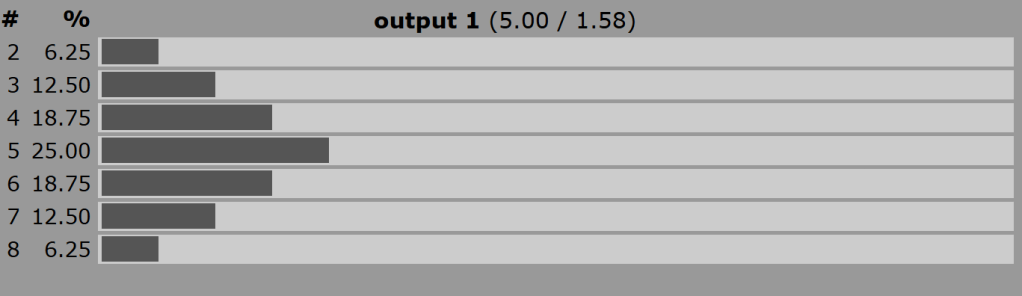
Scroll through to see the similar bell-shaped pattern and the specific distributions of chance. This is 2d4. 
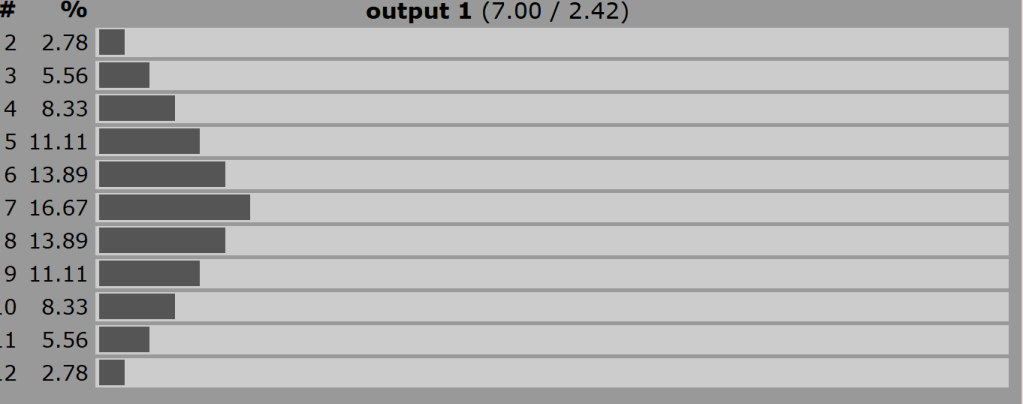
Scroll through to see the similar bell-shaped pattern and the specific distributions of chance. This is 2d6. 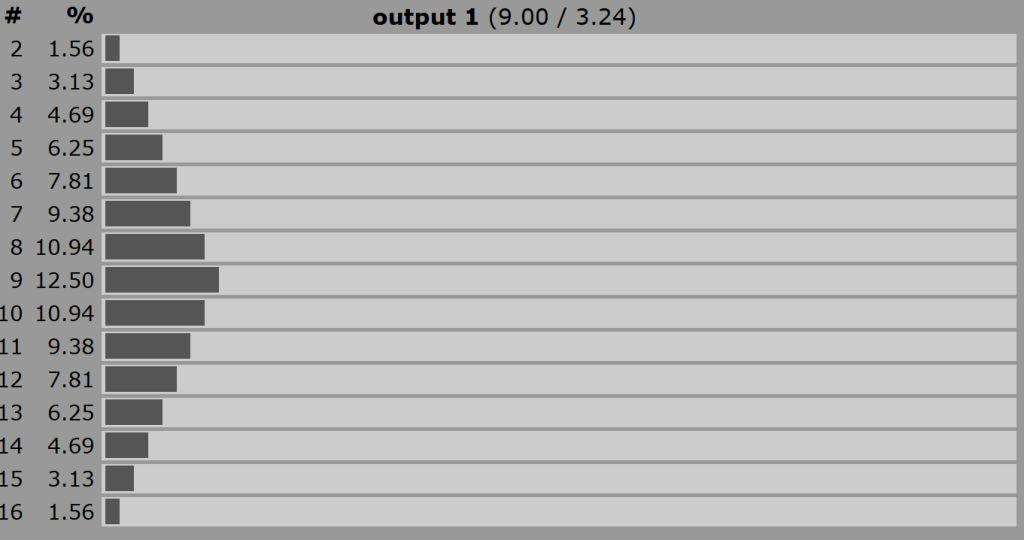
Scroll through to see the similar bell-shaped pattern and the specific distributions of chance. This is 2d8. 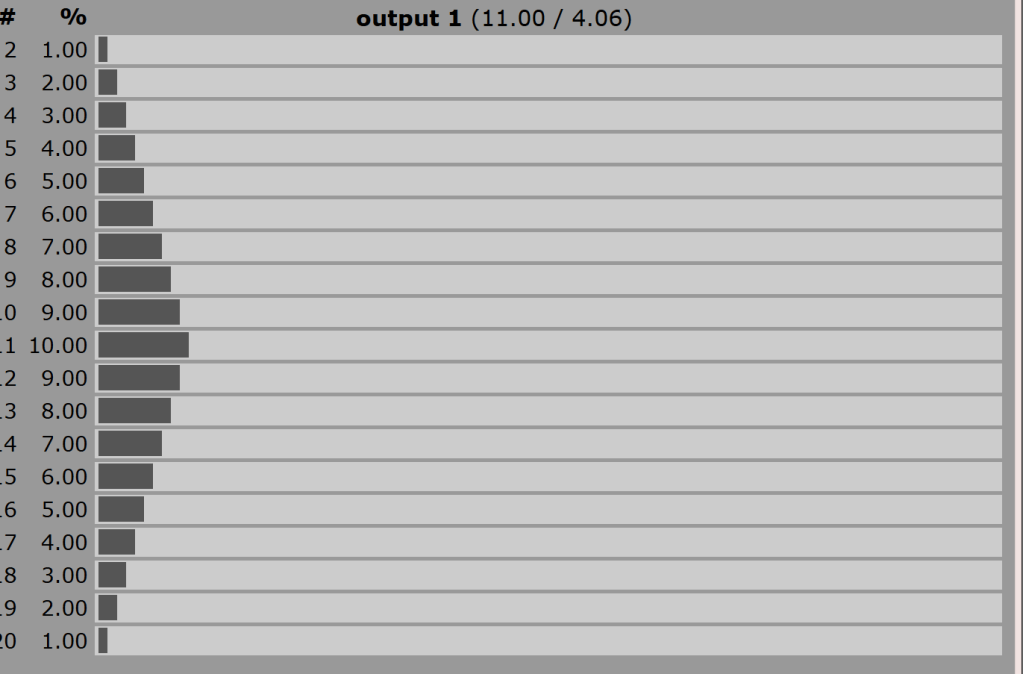
Scroll through to see the similar bell-shaped pattern and the specific distributions of chance. This is 2d10. 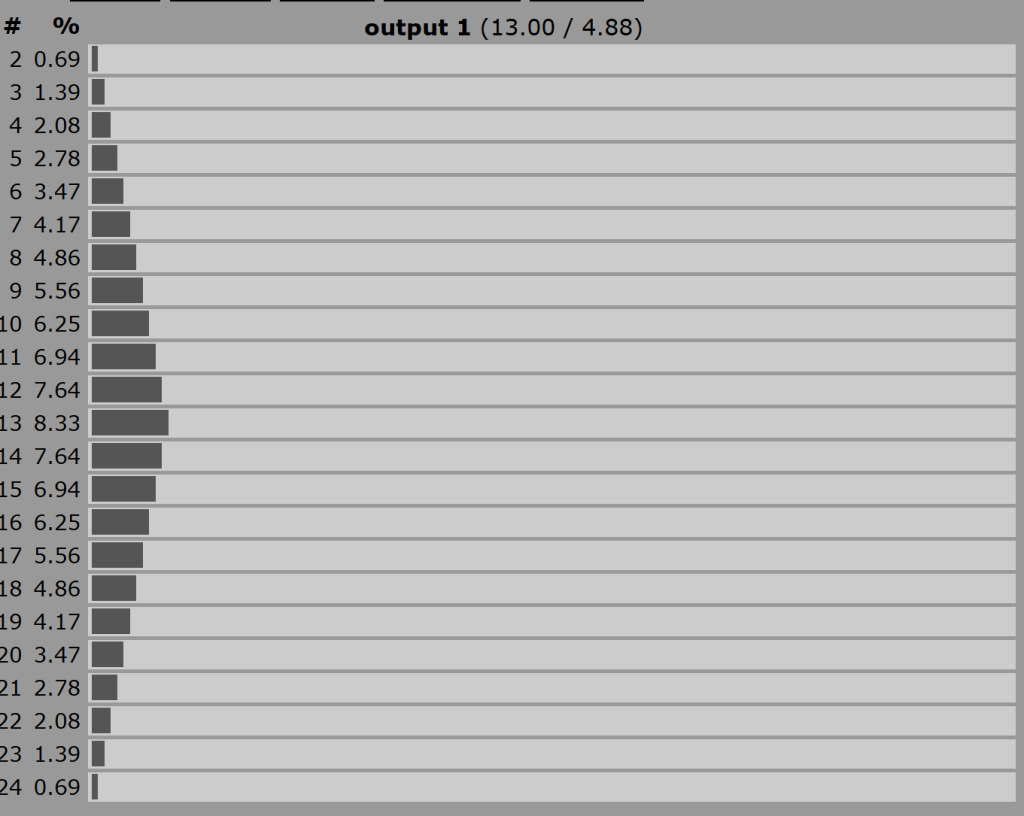
Scroll through to see the similar bell-shaped pattern and the specific distributions of chance. This is 2d12.
Oh, and the same curve occurs, but steeper, the more dice you add to the pool, meaning different pools will give you different probability curves for roughly the same set of numbers:
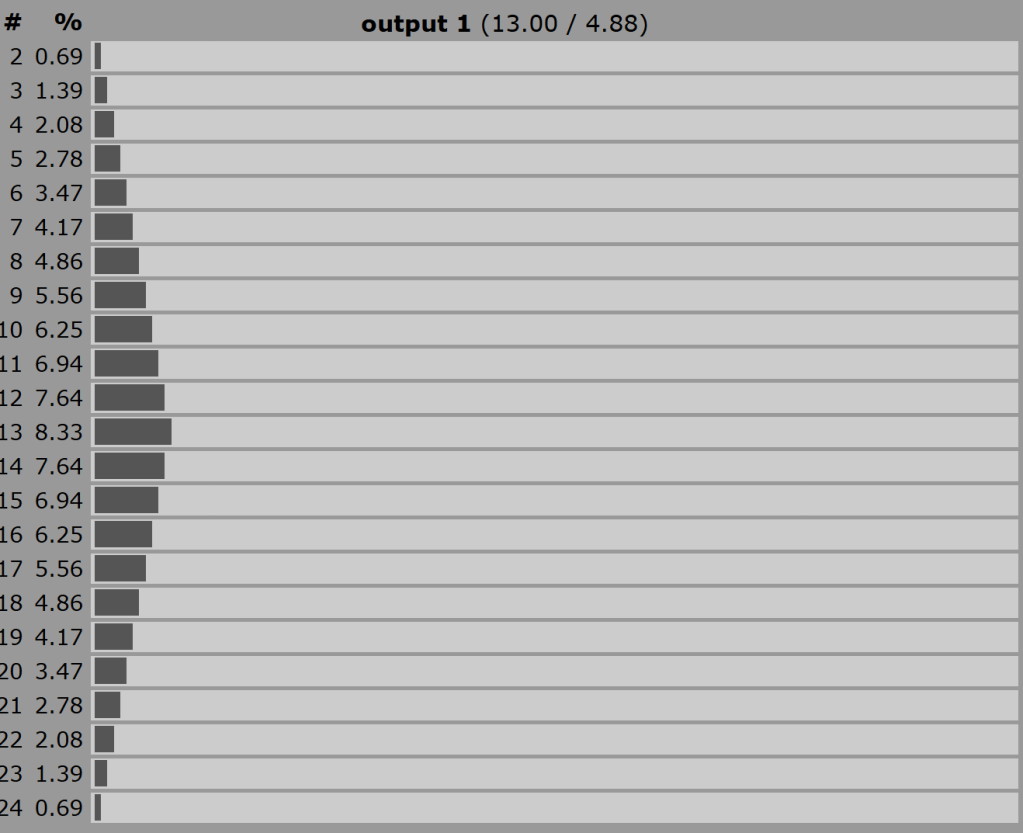
This is for 6d4 and 2s12, respectfully. See how different the distribution is (although it’s worth noting that 6d4 is a range from 6 to 24, and 2d12 is a range from 2 to 24, so slightly different). 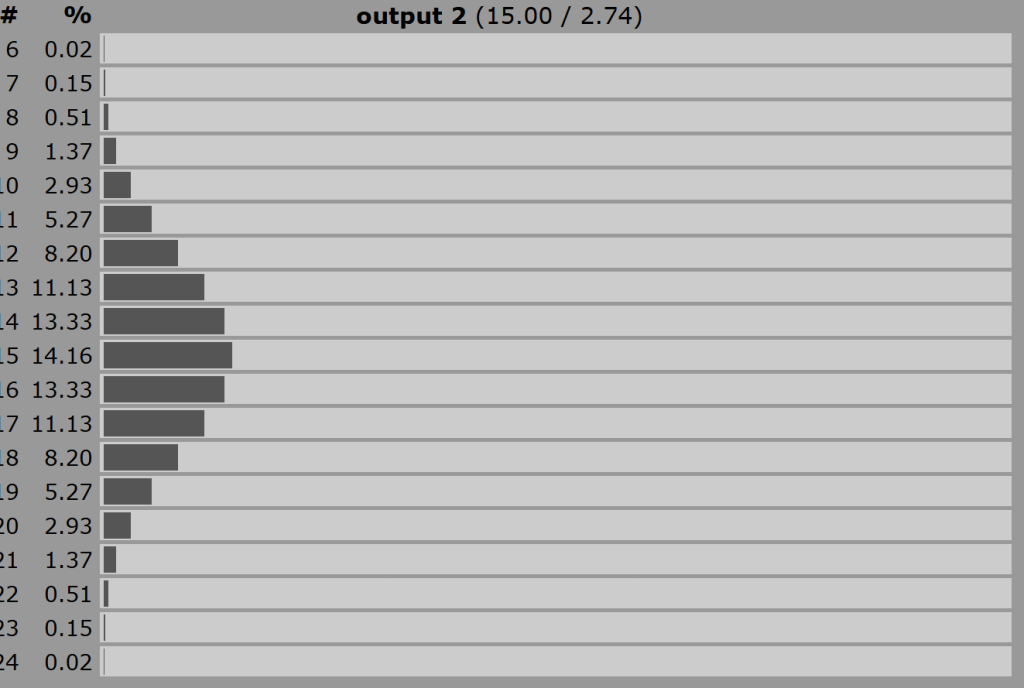
This is for 6d4 and 2s12, respectfully. See how different the distribution is (although it’s worth noting that 6d4 is a range from 6 to 24, and 2d12 is a range from 2 to 24, so slightly different).
It also works for adding different dice sizes, for what it’s worth. We always have the same shaped likelihood of results:
The key takeaway here: If you roll more than one dice together, you are changing the odds of your list appearing. Don’t just do it to get a range: “I want 18 results so I’ll just use 3d6” is wrong both because it only gets you 16 results, but also because you’ll rarely see a bunch of those results, and will commonly get a bunch of them. If you want to do that, look at Equal Opportunity Dice. By adding dice together, your values suddenly have meaning attached to them. You need to take advantage of that meaning, or it’ll change the way your table rolls.
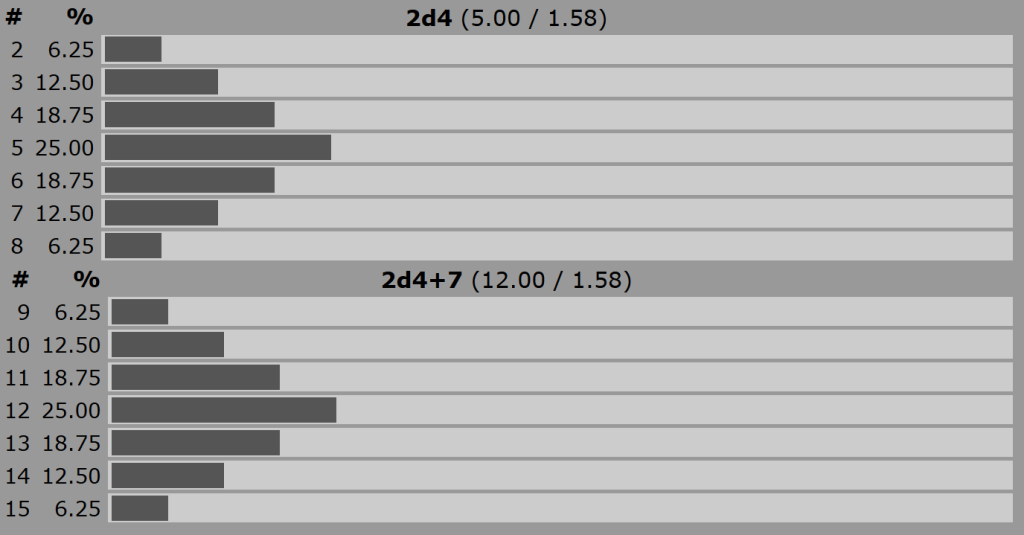
Importantly, the curve will remain the same if you add to it, meaning the likelihood shifts with the numbers. I’m explaining that badly, but it’s useful. Here’s a visual illustration:
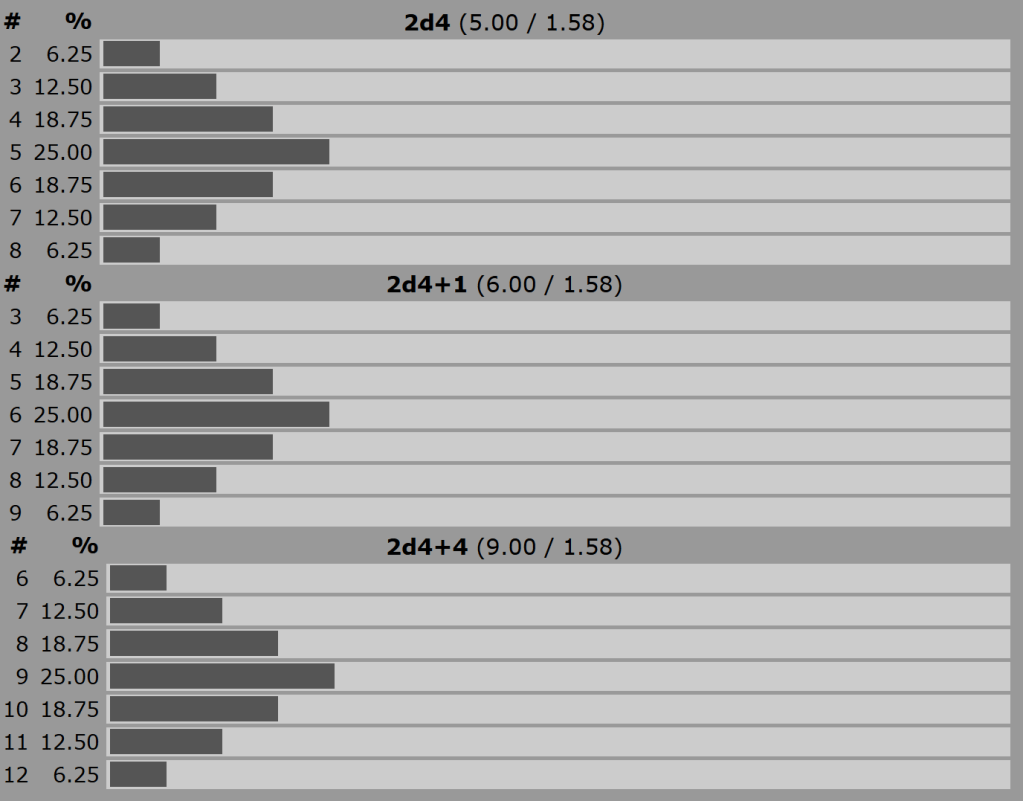
You can see here, that in the 2d4 curve, the likelihood of rolling a 6 is 18.75%, but when you add 4, it’s now 6.25%. Now, 18.75% of the time you’ll roll an 8 or a 10 instead. This is can be used in interesting ways: You could have a list of 13 items, and have a cumulative bonus applied to the roll as certain events develop, with the lower numbers on your list no longer occurring, the middle items changing likelihoods at first more so, and then less, and the higher numbers appearing. I could do this with an encounter table, for example, where the volcano slowly got closer to errupting over time, or a reaction table where you gained reputation over time. It might look like this:
That’s curves, in a nutshell. They’re everywhere, so pay special attention if you’re rolling with a curve, about exactly where your items are on that curve, and whether that means your items are occurring as often as you want to occur.
Basic Structure: Roll multiple dice and add the results.
Effect: A list of items where the largest and smallest results are rarest, and the middle-most result is the most common.
Requirements: You cannot roll more dice and then drop the highest or lowest or the probability will change for each item.
Alternatives: Use addition or subtraction bonuses to adjust the numbers affected by the curve.
Hope this helps!
Idle Cartulary
Playful Void is a production of Idle Cartulary. If you liked this article, please consider liking, sharing, and subscribing to the Idle Digest Newsletter. If you want to support Idle Cartulary continuing to provide Bathtub Reviews, I Read Reviews, and other work, please consider a one-off donation or becoming a regular supporter of Idle Cartulary on Ko-fi.


Leave a comment